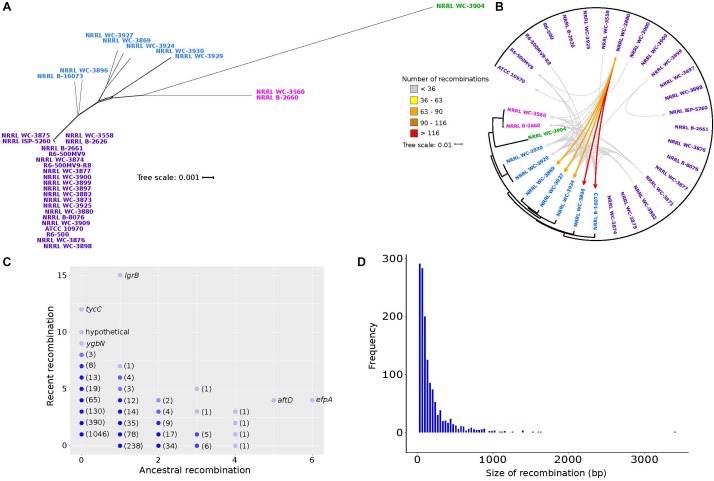
Figure 3.
Genetic relationships among S. rimosus strains are influenced by homologous recombination. (A) A phylogenetic network of the S. rimosus core genome generated using SplitsTree. The strain names were colored according to clustering results using BAPS. (B) Donor-recipient linkages of major recombination events (i.e., highways of recombination) identified using fastGEAR and BLASTN. Scale bar represents nucleotide substitutions per site. Each arrow represents a certain number of recombination events between a pair of genomes, with different colors representing the range of numbers. (C) Genes that have undergone recent or ancestral recombination. Horizontal axis shows the estimated number of ancestral recombinations and vertical axis shows the estimated number of recent recombinations. Names of some of the genes are shown. Numbers in parenthesis indicate the number of genes represented by overlapping dots found on the same position. (D) Frequency histogram of the size of recombination events of all genes in the pan-genome.

