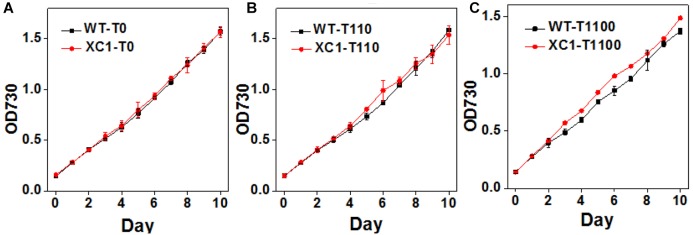
Figure 3.
Growth assays of PCC7942-WT and PCC7942-XC1 under induction of gradually increasing theophylline concentrations. (A) No theophylline was added; (B) 110 μM theophylline was added; (C) 1100 μM theophylline was added. Optical densities under 730 nm (OD730) were used to calculate cell concentrations. The data utilized are averages of measurements from at least three independent biological repeats, and the standard deviations bars are shown.

