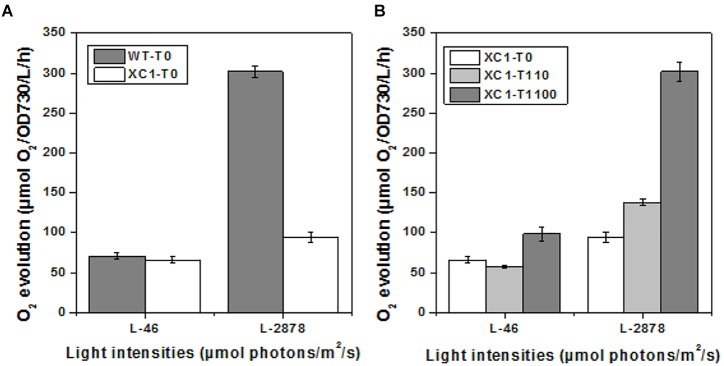
Figure 4.
Oxygen evolution of PCC7942-WT and PCC7942-XC1 cells under different illumination. L-46 represented light intensities of 46 μmol/m2/s; L-2878 represented light intensities of 2878 μmol/m2/s. The data shown are averages of at least three independent measurements, and standard deviation bars are also shown. (A) PCC7942-WT and PCC7942-XC1 under 0 μM theophylline; (B) PCC7942-XC1 under induction of 0 μM, 110 μM, 1100 μM theophylline, respectively.

