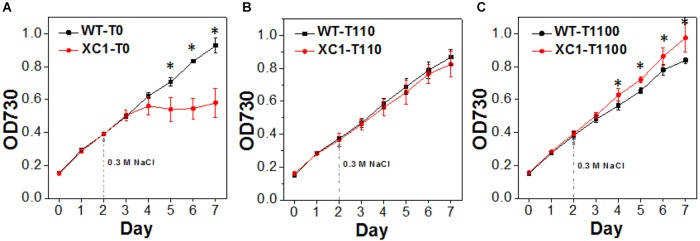
Figure 5.
Growths of PCC7942-WT and PCC7942-XC1 facing NaCl stress under theophylline concentrations of (A) 0 μM, (B) 110 μM, and (C) 1100 μM. 0.3 M NaCl was supplemented into the culture medium in Day 2 as the arrow pointed. The OD730 data utilized are averages of measurements from at least three independent biological repeats, and standard deviation bars are also shown. Asterisksg49 indicate significant differences between the data of WT and XC1 (Student’s t-test, P < 0.05).

