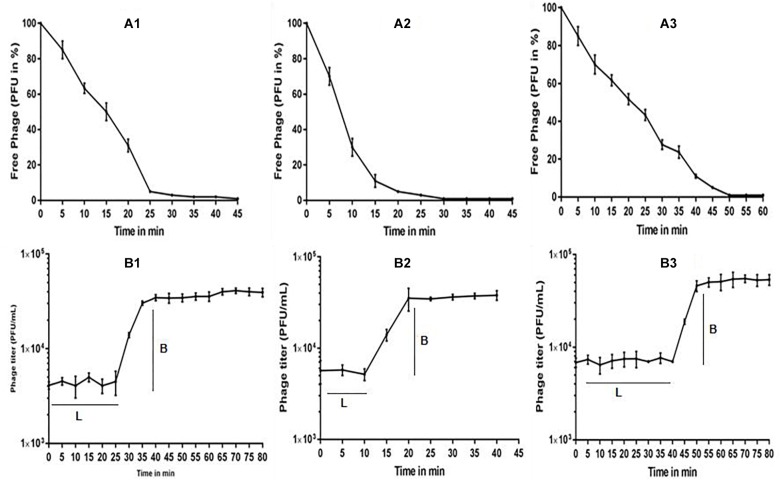
FIGURE 2.
(A) Adsorption rate of phages to their bacterial host, (A1) Escherichia virus myPSH2311, (A2) Enterobacter virus myPSH1140, (A3) Klebsiella virus myPSH1235, and (B) One-step growth curve experiment of phages, (B1) Escherichia virus myPSH2311, (B2) Enterobacter virus myPSH1140, (B3) Klebsiella virus myPSH1235. Legend within figure B: L-latency period; B-burst size.

