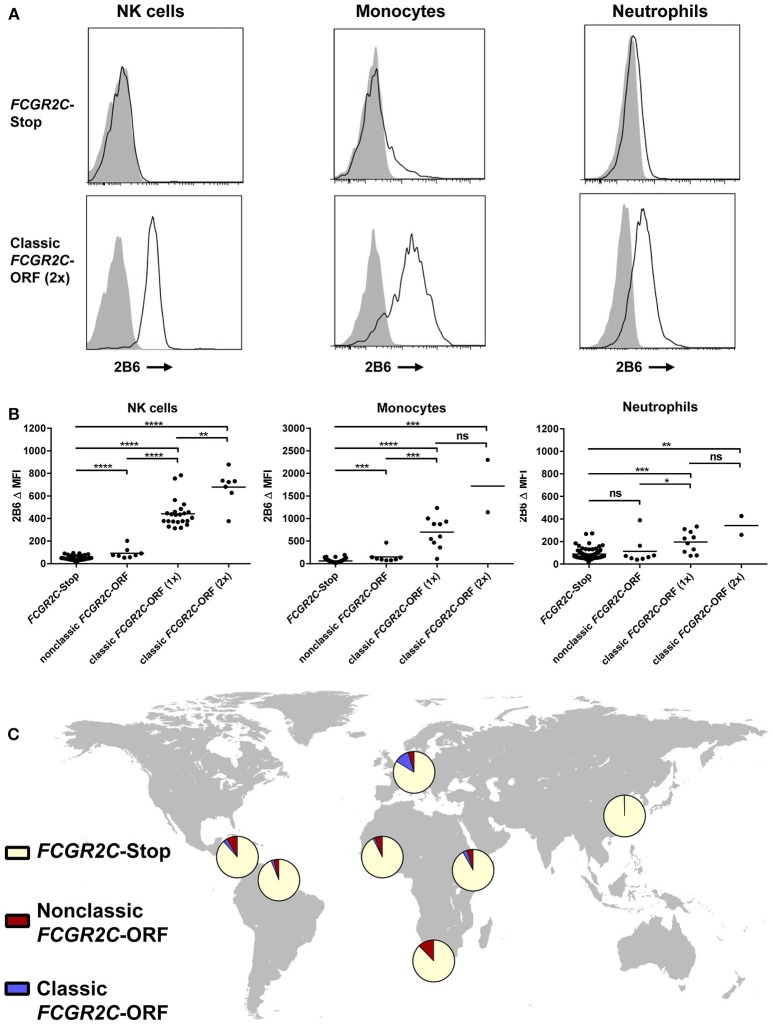
Figure 2.
Haplotypes of FCGR2C determine expression of FcγRIIc. (A) Representative histograms of staining with MoAb 2B6 on NK cells (left), monocytes (middle), and neutrophils (right) of an individual homozygous for FCGR2C-Stop variant (upper panel) and an individual homozygous for the FCGR2C-ORF variant (lower panel). 2B6 recognizes the extracellular domain of both FcγRIIb and FcγRIIc. In FCGR2C-Stop individuals, FcγRIIc cannot be expressed, therefore staining of 2B6 in those individuals must be FcγRIIb only. Black line: 2B6, gray shading: isotype control. (B) Summary of 2B6 staining, corrected for isotype control, on human NK cells (left), monocytes (middle) and neutrophils (right) of genotyped individuals. Y axis scale is different for monocytes than for the other cell types. Because FcγRIIb is also stained by 2B6, only cells that do not express FcγRIIb can be easily analyzed for FcγRIIc expression. Therefore, individuals with a deletion of CNR1 were excluded from the analysis of NK cells, and individuals with a 2B.4 promoter haplotype in FCGR2B were excluded from the analysis of monocytes and neutrophils, because these variants result in ectopic expression of FcγRIIb on NK cells (35), or myeloid cells (36), respectively. NK cell analysis: FCGR2C-Stop n = 93, nonclassic FCGR2C-ORF, including cases with 1 or 2 copies n = 8, FCGR2C-ORF(1x), with 1 copy of the classic FCGR2C-ORF haplotype, n = 23, FCGR2C-ORF(2x), with 2 copies n = 7. Monocyte and neutrophil analysis: FCGR2C-Stop n = 99, nonclassic FCGR2C-ORF, including cases with 1 or 2 copies n = 8, FCGR2C-ORF(1x), with 1 copy of the classic FCGR2C-ORF haplotype, n = 10, FCGR2C-ORF(2x), with 2 copies n = 2. Some individuals were analyzed more than once at different time points with similar results; means are shown for these. All individuals analyzed are of European descent except for five FCGR2C-Stop and two nonclassic FCGR2C-ORF individuals who were of African origin. (C) World map showing allele frequencies of FCGR2C haplotypes for different ethnic groups. MFI, median fluorescence intensity; ns, non-significant; *p < 0.05; **p < 0.01; ***p < 0.001; ****p < 0.0001 as determined by Mann Whitney test.

