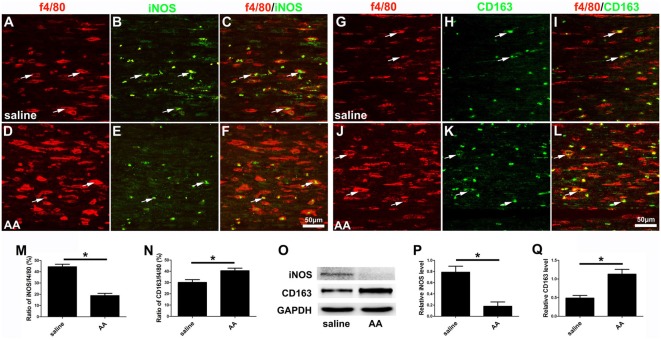
Figure 10.
AA inhibits the M1 polarization of macrophages but promotes M2 polarization in vivo. (A–F) Representative images of f4/80 (red) and iNOS (green) double immunohistochemistry in each group. (G–L) Representative images of f4/80 (red) and CD163 (green) double immunohistochemistry in each group. (M) The ratio of iNOS/f4/80 in each group (n = 3, *P < 0.05). (N) The ratio of CD163/f4/80 in each group (n = 3, *P < 0.05). (O–Q) Western blots and schematic diagrams of the statistical analysis showing the protein levels of iNOS and CD163 in the distal trunk of the injured sciatic nerves (n = 3, *P < 0.05).

