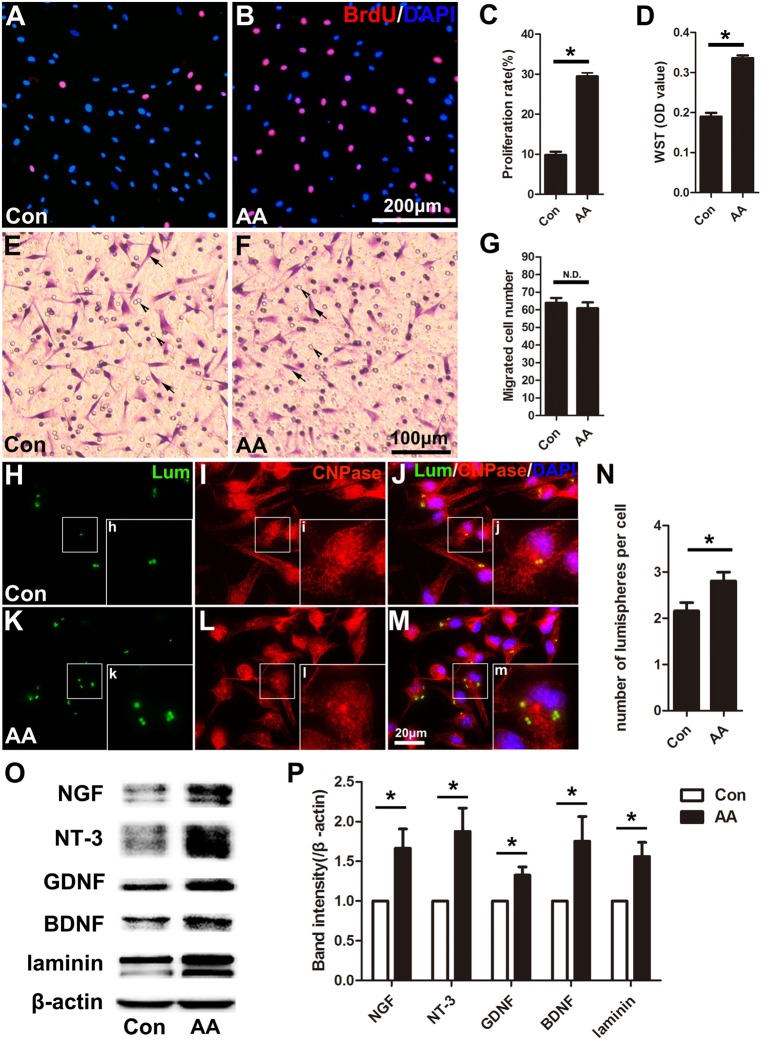
Figure 6.
AA promotes proliferation, phagocytosis and neurotrophic factor secretion in Schwann cells (SCs) but does not affect the migration of SCs in vitro. (A,B) Representative images of BrdU immunofluorescence staining from each group. The total cells were labeled with DAPI (blue). (C,D) Quantitative analysis of the BrdU and WST assays (n = 3, *P < 0.05). (E,F) Representative images showing migrated SCs (arrows) from each group (arrowheads indicate the micropores on the membrane). (G) Statistics showing there was no significant difference between the two groups (n = 3, N.D. indicates no significant difference). (H–M) Images showing the ingested lumispheres (green) within the cells. The SCs were identified with CNPase immunocytochemistry (red). (N) Quantitative analysis of the number of lumispheres per cell (n = 3, *P < 0.05). (O) Western blots and (P) their quantification indicate the expression level of neurotrophic factors (n = 3, *P < 0.05).

