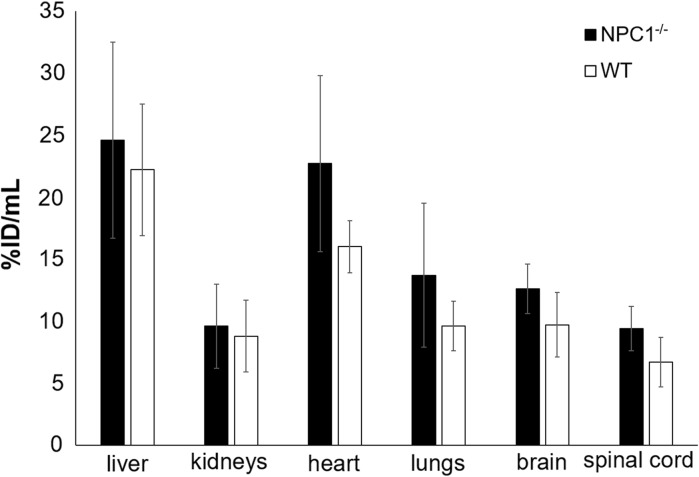
Fig. 2.
Uptake (%ID/mL) of 64Cu in organs distinguishable on PET scans of 9-week-old Npc1−/− (red bars, n = 7) and WT (blue bars, n = 5) mice 15 h post injection of 64Cu-GTSM, determined by quantitative image analysis. Error bars represent ± one standard deviation. The same trends are evident as in Fig. 7 but the standard deviations are larger because of the intrinsic limitations of PET region of interest quantification and volume determination

