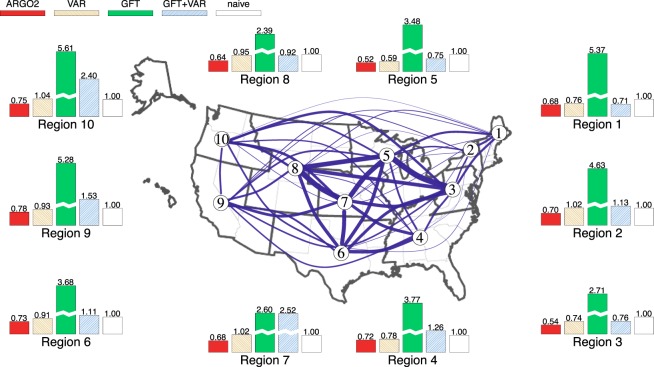
Figure 1.
The ten US HHS regions: cross-regional correlation and estimation error breakdown. The US HHS regions include: Region 1 (CT, MA, ME, NH, RI, VT), Region 2 (NJ, NY), Region 3 (DE, MD, PA, VA, WV), Region 4 (AL, FL, GA, KY, MS, NC, SC, TN), Region 5 (IL, IN, MI, MN, OH, WI), Region 6 (AR, LA, NM, OK, TX), Region 7 (IA, KS, MO, NE), Region 8 (CO, MT, ND, SD, UT, WY), Region 9 (AZ, CA, HI, NV), and Region 10 (AK, ID, OR, WA). The width of the link between two regions corresponds to the strength of the correlation between two regions’ historic %ILI (wider represents higher correlation). The bars compare the region-by-region estimation error of ARGO2, VAR, GFT, GFT+VAR, and the naive method in terms of the relative MSE to the naive method for the period of March 29, 2009 to August 15, 2015. All methods and metrics in comparison are defined in Methods section.

