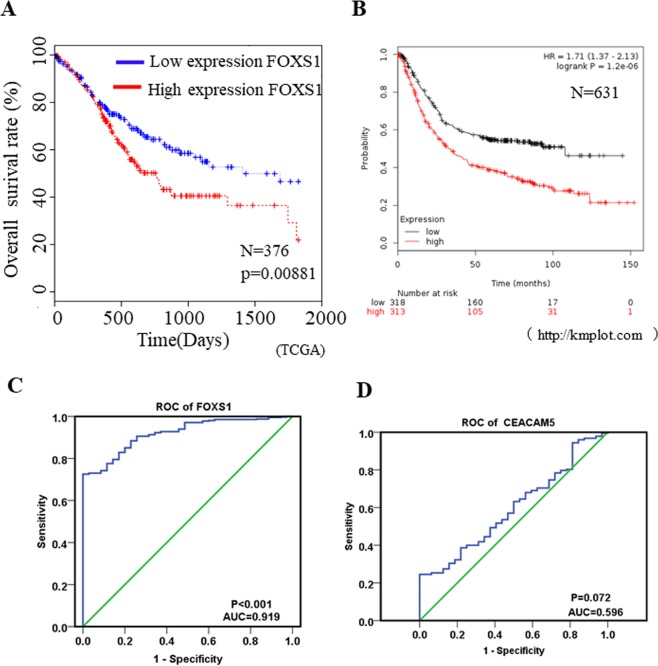
Figure 2.
High expression of FOXS1 indicates poor prognosis for gastric cancer patients (A) Kaplan-Meier curves of patients with gastric cancer with low versus high expression of FOXS1 using TCGA sequencing data (N = 371; P = 0.00881). (B) Kaplan-Meier curves of patients with gastric cancer with low versus high expression of FOXS1 using online software Kaplan-Meier Plotter (http://kmplot.com) (N = 631; P < 0.001). (C) ROC curve of FOXS1was determined by SPSS and the AUC was 0.919, P < 0.001. (D) ROC curve of CEACAM5 was determined by SPSS and the AUC was 0.596, P = 0.072.

