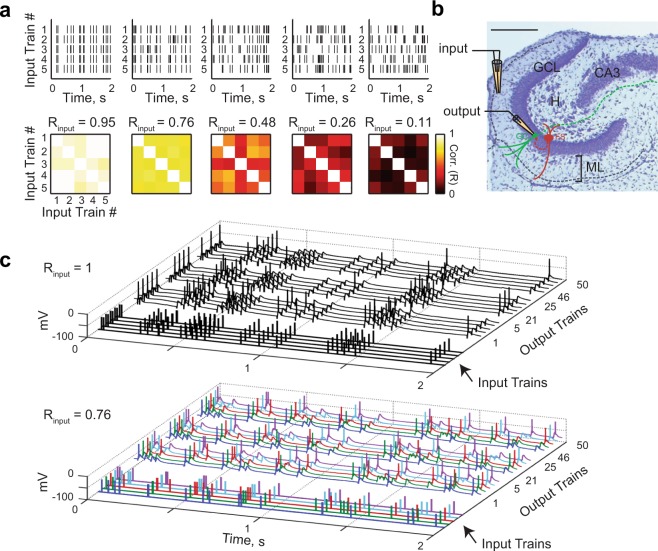
Figure 1.
Pattern separation assay in acute brain slices at the single cell level. (a) Examples of input sets. Top: each input set comprises five different trains of electrical pulses. Bottom: correlation coefficient matrix for each input set, each square representing the correlation coefficient between two input trains measured with a binning window (τw) of 10 ms. Rinput is the average of coefficients, diagonal excluded. (b) Histology of the DG in a horizontal slice (Cresyl violet/Nissl staining; scale bar: 250 µm), overlaid with a schematic of the experimental setup: a theta pipette in the ML (input) is used to focally stimulate the PP while a responding GC (output) is recorded via whole-cell patch-clamp. (GCL: granule cell layer, H: hilus, ML: molecular layer, FS: fast-spiking interneuron. Solid lines represent dendrites and dashed lines axons). (c) Current-clamp recordings of the membrane potential of two different GCs in response to different input sets (Top: Rinput = 1; Bottom: Rinput = 0.76). Each input set (five input traces) is repeated ten times (only three repetitions are shown, with spikes truncated at 0 mV). In the bottom graph, input trains and their respective children output spiketrains have matching colors.

