Figure 2.
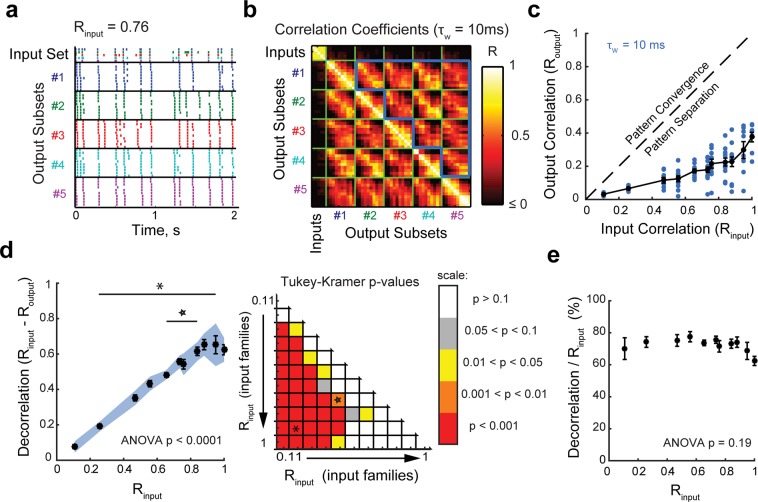
Input spiketrains are decorrelated at the level of individual granule cells. (a) Example of a recording set (input set + output set): the raster plot shows one set of input spiketrains and the children output spiketrains recorded from one GC, reordered to display output subsets (i.e., the ten children coming from one parent input spiketrain) together and with the same color. (b) Corresponding 55 × 55 correlation coefficient matrix using a binning window (τw) of 10 ms. Each small square represents the correlation coefficient between two spiketrains. Routput is defined as the mean of correlations between individual output spiketrains driven by different input spiketrains, as outlined by the bold blue border, which excludes comparisons between outputs generated from the same parent input. (c) Data points, corresponding to 102 recording sets (28 GCs), are all below the identity line (dashed line). This means that Routput was lower than Rinput.for all recordings, thus demonstrating pattern separation. (d) Left: Effective decorrelation averaged over all recording sets as a function of Rinput. Although there is a significant decorrelation for all tested input sets (one-sample T-tests: the blue shade indicates the 95% confidence interval that average decorrelation is significantly above 0), they are effectively decorrelated to different magnitudes (one-way ANOVA, p < 0.0001). Right: Matrix of p-values from post-hoc Tukey-Kramer tests comparing effective decorrelation levels across all pairs of parent input sets. The asterisk and star correspond to the comparisons displayed in the left panel. This analysis shows that the decorrelation is significantly different (higher) for highly similar input spiketrains than for already dissimilar inputs. (e) When the effective decorrelation is normalized to the correlation of the input set, there is no significant difference between input sets (ANOVA, p = 0.19). In all graphs, τw = 10 ms. Means and SEM in black.

