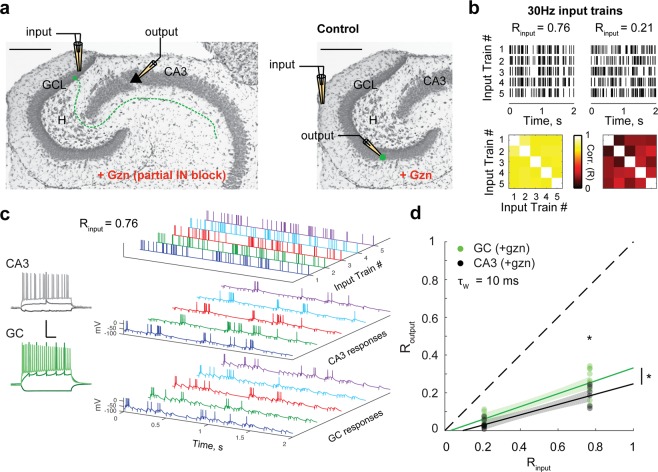
Figure 4.
CA3 pyramidal cells exhibit more temporal pattern separation than GCs. (a) Schematic of the experimental setup: a theta pipette in the granule cell layer (GCL) is used to stimulate GCs and their mossy fibers (dashed line) to evoke action potentials in CA3 pyramidal cells recorded via whole-cell patch-clamp. To limit feedforward inhibition and allow pyramidal cells to spike, experiments were performed under partial block of inhibition (100 nM of gabazine). Control experiments were performed in GCs under the same pharmacological conditions but with OML stimulations. (b) Two input sets of 30 Hz Poisson trains were used. Top: rasters of the five spiketrains of each set. Bottom: correlation coefficient matrix for each input set (τw = 10 ms). (c) Example of current-clamp recordings from a pyramidal cell and a GC from the same animal. Left: Membrane potential responses to current steps (−100 pA, 100 pA, 350 pA). Scale: 100 ms (horizontal) and 50 mV (vertical). Right: example of 5 output responses (sweeps 11–15) to an input set (Rinput = 0.76). (d) Routput versus Rinput for CA3 pyramidal cells and GCs. Data points correspond to recording sets: 15 for CA3 (black, 14 cells, 6–9 recordings per input set), and 22 for GC (green, 13 cells, 11 per input set). The CA3 distribution is lower and significantly different from the GC distribution: ANCOVA: p < 0.01, 95% confidence bounds around the linear fits shown as shaded areas; two-way ANOVA: input sets: p < 0.0001, cell-types: p = 0.0036, interaction: p = 0.24. Post-hoc T-tests with Bonferroni corrections for two comparison groups: p = 0.032 for Rinput = 0.76, p = 0.1 for Rinput = 0.21.

