Figure 5.
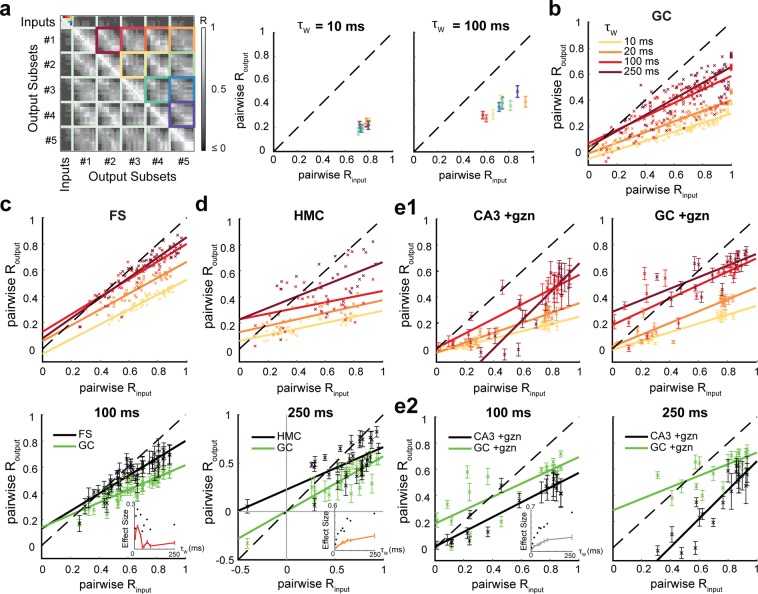
Differences in temporal pattern separation between hippocampal celltypes depend on the timescale. (a) Pairwise analysis. Instead of averaging across all five input trains of a set (here Rinput = 0.76 at τw = 10 ms, same matrix as in Fig. 2b), we average children output coefficients corresponding to a single pair of input trains (identified by color-coded squares.). This finer analysis is necessary at τw higher than 20 ms because the pairwise input correlation coefficients are not well constrained around their mean anymore (see right panel). Middle and Right: mean across cells, following the same color-code as displayed in the matrix (Left). (b) Pairwise Routput vs pairwise Rinput for GCs, measured with different binning windows τw. Only the means across cells are displayed, but the regression line was fitted on the full distribution of data points. The larger τw, the less GCs exhibit pattern separation. (c) Top: Pairwise analysis on FS recordings (same as in b). Bottom: mean ± SEM and regression lines for τw = 100 ms: FS and GC distributions are still different, especially at high input similarity (ANCOVA: p < 0.0001 for τw = 10 up to 250 ms). Lower right inset: effect size as a function of the timescale τw (up to 250 ms): Mean ± SEM (red) and maximum (black dots) of the absolute difference between FSs and GCs Routput mean values for all pairwise Rinput. Note a decreasing effect of larger τw on the difference between FSs and GCs in terms of pattern separation. (d) Top: Pairwise analysis on HMC recordings (same color code as in b). Bottom: At τw = 250 ms, HMC and GC distributions are different (ANCOVA: p < 0.0001 for τw = 10 up to 250 ms), especially at lower input similarity: notice the points above the identity line, showing pattern convergence for HMCs in contrast to GCs. Under this pairwise analysis (in contrast to Fig. 3b), HMCs and GCs are significantly different at τw = 10 ms (comparison graph not shown, see inset for effect size). However, the inset (see c for legends) shows an increasing effect of τw on the difference between HMCs and GCs in terms of pattern separation. (e1) Pairwise analysis on CA3 pyramidal cells and GCs, both under partial inhibition block and under 30 Hz inputs (same color code as in b). (e2) At τw = 100 ms and 250 ms, CA3 and GC distributions are still different (ANCOVA: p < 0.0001). The inset (see c for legends) shows an increasing effect of τw (plateauing at large timescales) on the difference between CA3 PCs and GCs.

