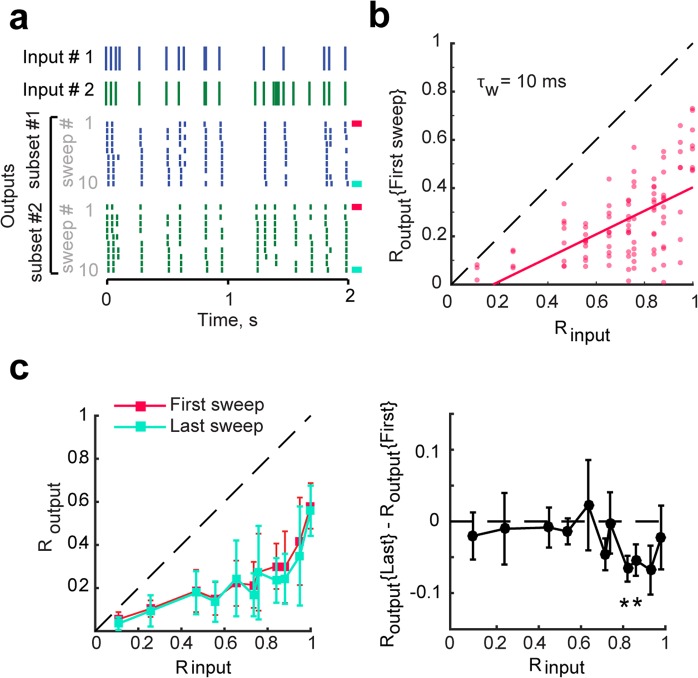
Figure 6.
Input spiketrains are efficiently separated upon their first presentations. (a) Two of five inputs are shown with corresponding output spiketrains. The first output sweep is marked with a pink bar (right) and last sweep is marked with a blue bar. (b) Routput, computed from the first sweep of five output trains only (pink), as a function of Rinput, with linear fit. All data points are below the identity line indicating that outputs are effectively decorrelated compared to their inputs even when input patterns have only been presented once each. The average decorrelation (Rinput − Routput) is significant for all input sets (one-sample T-tests, p < 0.01) except for Rinput = 0.11 (p = 0.1). (c) Left: Output correlations (Mean ± SEM) between spiketrains of the first sweep (pink) and the last sweep (blue). There is no significant difference (ANCOVA, p = 0.33). Right: When taking into account that the two distributions are paired, we detect that a few output correlations are significantly lower for the last sweep than for the first one (one-sample T-test on the difference between Routput of the first and last sweep of each recording set, asterisks signify p < 0.05). This is evidence, though weak, that repetition of input spiketrains might improve pattern separation for highly similar inputs.

