Figure 8.
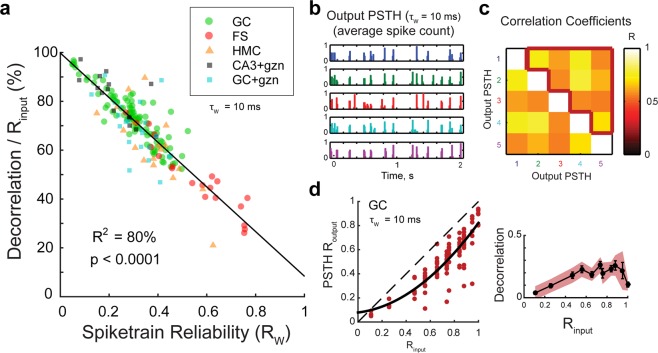
Unreliability in spiketrain transmission is a major but not unique source of temporal pattern separation. (a) Spiketrain reliability (RW) is an excellent predictor of normalized decorrelation (defined in Fig. 2E) for all celltypes and conditions. Notice that, despite the strong anticorrelation, the intercept of the linear model at Rw = 1 predicts that even a perfect reliability could still allow 10% of decorrelation. See Table S3 for linear regressions on single celltypes. (b) To assess the amount of decorrelation not due to spiketrain unreliability, the ten children output spiketrains of each of the five trains of an input set can be averaged to give the five output peristimulus histograms (PSTH). The 10 ms binned PSTHs of the output rasters in Fig. 2a are shown. (c) Correlation coefficients between all pairs of the five output PSTHs. The mean correlation (PSTH Routput) is the average of coefficients inside the red border, and excludes self-comparisons. (d) Left: PSTH Routput as a function of Rinput (102 recording sets, in red), fitted with a parabola (black). All points are below the identity line indicating decorrelation of outputs compared to inputs. Right: Average effective decorrelation (Rinput − PSTH Routput) as a function of Rinput (bars are SEM) reveals a significant decorrelation for all input sets except for the most dissimilar (one-sample T-tests; shaded area is the 95% confidence interval for significant decorrelation).

