Fig. 6.

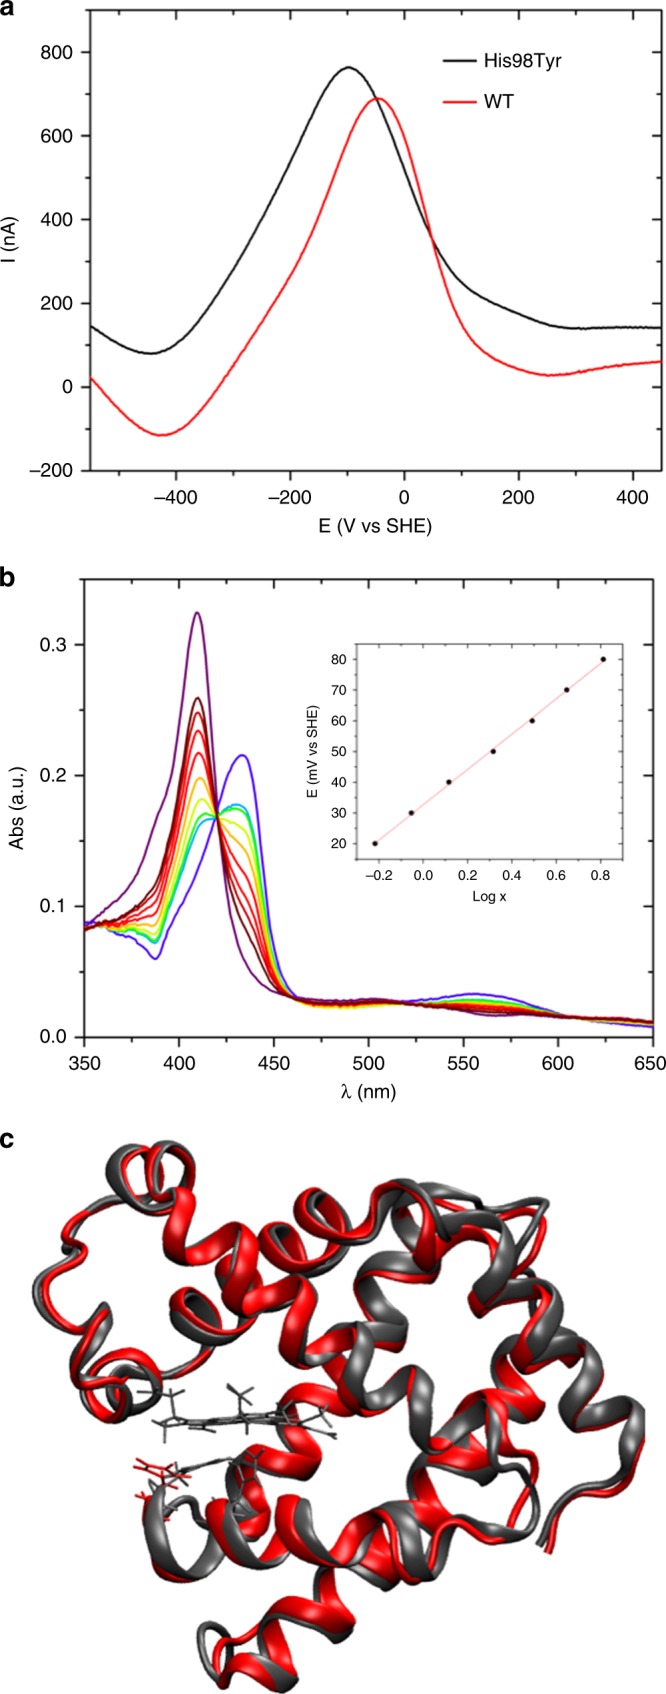
In vitro and in silico studies of WT and mutant MB. a Typical square wave voltammograms recorded for WT (black) and p.His98Tyr mutant (red) human myoglobin immobilized on a Au electrode in 20 mm phosphate buffer, pH 7.0, 25 °C. b Electronic spectra of p.His98Tyr mutant of human myoglobin obtained at various applied potentials E in spectroelectrochemical experiments carried out with an optical thin-layer electrochemistry cell at pH 7.0, 25 °C. The corresponding Nernst plot is shown in the inset, where x = [(Amaxλred−Aλred)−(Amaxλox−Aλox). c Overlay of cartoon representations of representative structures sampled within the MD simulations for native (red) and p.His98Tyr mutant (black) human myoglobin. His98 is also shown as stick with the same color coding. The heme group and Fe-ligand residue His94 is shown only for WT for sake of clarity
