Fig. 7.
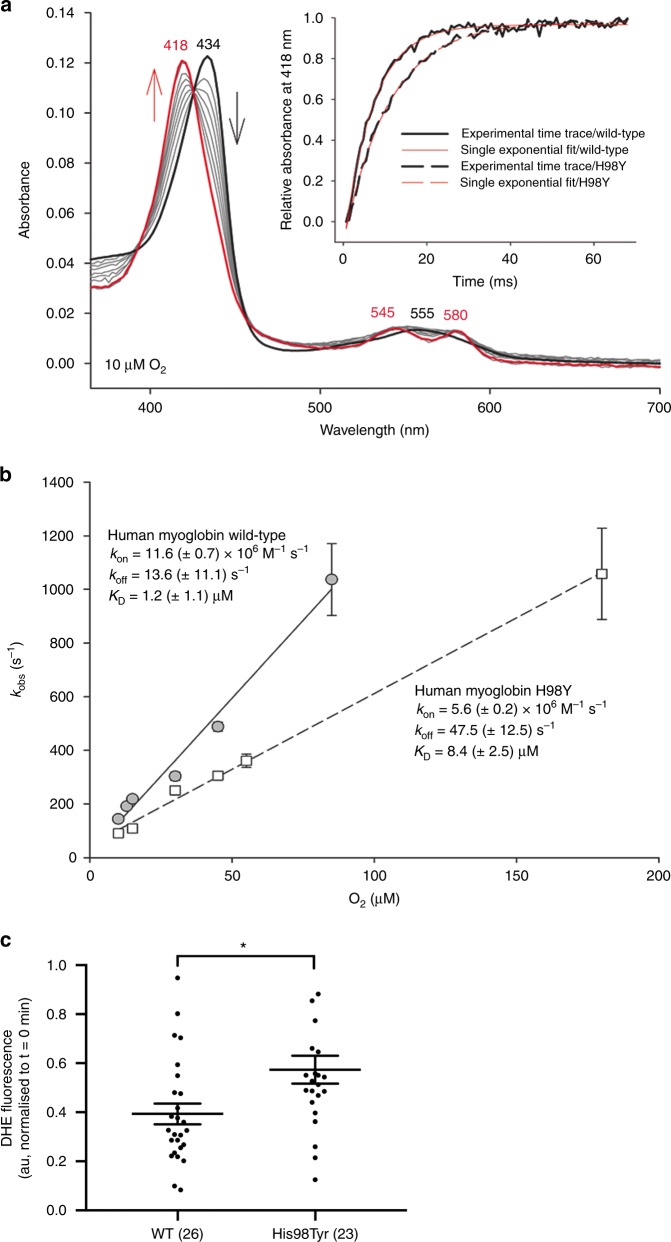
Kinetics of dioxygen binding to wild-type human myoglobin and the variant His98Tyr. a Spectral changes upon reaction of 1 µm ferrous wild-type hMb (black line) with 10 µm O2. The final spectrum represents oxymyoglobin (red line, 68 ms after mixing). Gray lines represent spectra obtained at 0.68, 2.72, 4.08, 6.12, 8.84, 12.24, 34.00, and 51.00 ms after mixing. The inset depicts experimental time traces at 418 nm of wild-type hMb (solid black line) and p.His98Tyr MB (dashed black line) mixed with 10 µm O2 and corresponding single-exponential fits (solid red line, wild-type MB; dashed red line, His98Tyr MB). b Linear dependence of kobs values from the O2 concentration for wild-type MM (gray circles, solid line) and p.His98Tyr MB (white squares, dashed line). c Basal intracellular superoxide levels in HEK293FT cells expressing WT or mutant MB-EGFP. Data presented as individual data points and the mean ± SEM, numbers in parenthesis represent n. *indicates p = 0.007 (Mann–Whitney test, two-tailed)

