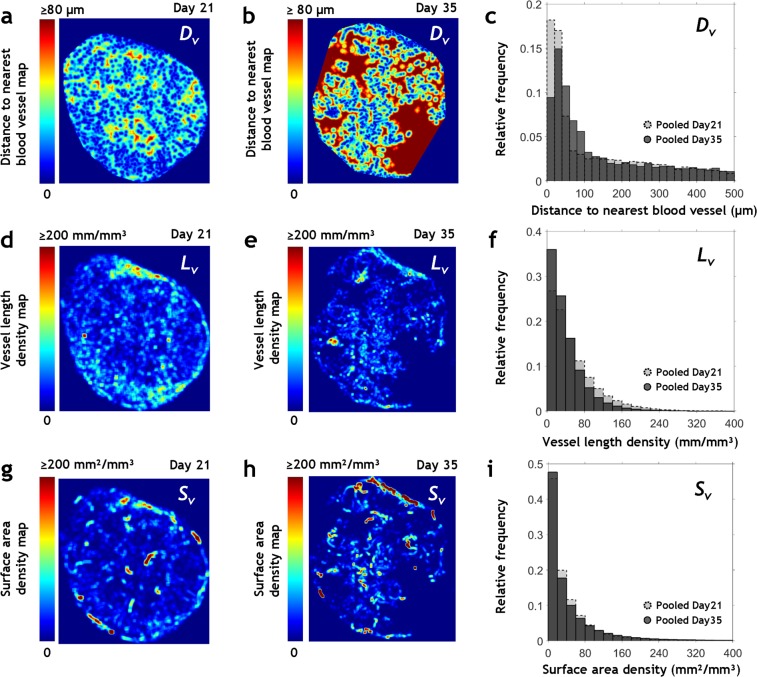
Figure 2.
Morphological heterogeneity of whole-tumor microvascular networks. Quantitative visualizations of spatial heterogeneity in: (a–c) Dv; (d–f) Lv, and (g–i) Sv in whole-tumor microvascular networks. The maximum intensity projection image from a 400 µm thick section from the tumor center was utilized for visualizing the spatial distribution of these parameters in Tumor 1 (smallest Day 21 sample) in (a,d,g) and for Tumor 8 (largest Day 35 sample) in (b,e,h), respectively. Dv maps (a,b) were computed on an 8 µm × 8 µm × 8 µm grid and Lv and Sv maps (d,e,g,h) were computed on a 160 µm × 160 µm × 160 µm grid. Probability distribution functions based on pooled Dv, Lv and Sv data are shown for Day 21 tumors (light grey) and Day 35 tumors (dark grey) in (c,f,i).

