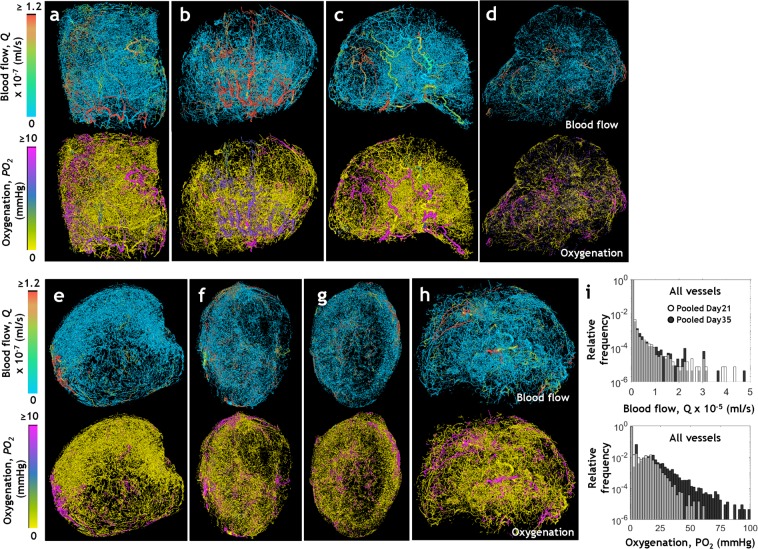
Figure 3.
Visualizing the spatial heterogeneity of whole-tumor hemodynamics and intravascular oxygenation. 3D visualizations of hemodynamic heterogeneity in microvascular networks derived from (a–c) Day 21 tumors and (d–h) Day 35 tumors wherein the vessels are color coded by their simulated blood flow rates, Q × 10−7 (ml/s) (in top row) and intravascular oxygenation, PO2 values (mm Hg) (in bottom row). (i) Pooled frequency distributions of simulated Q (top row) and PO2 (bottom row) for all vessels of Day 21 tumors (light grey) and Day 35 tumors (dark grey).

