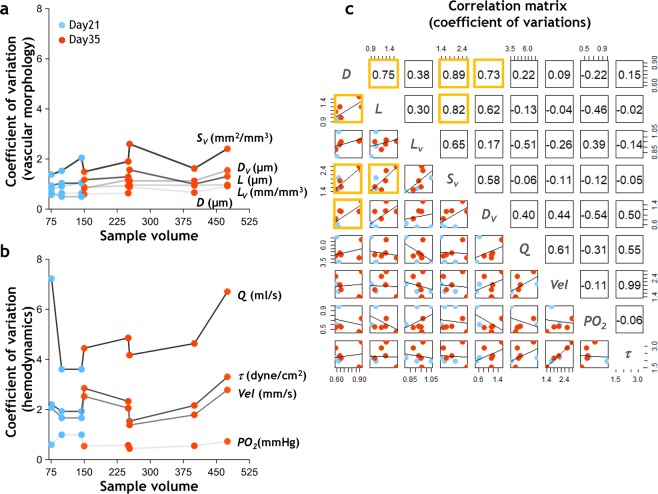
Figure 5.
Emergent whole-tumor hemodynamics were more heterogeneous than their underlying microvascular morphology. CV of (a) morphological parameters - D, L, Lv, Sv, and Dv - based on data from all vessels within each tumor; and (b) hemodynamic parameters - Q, Vel, τ, and PO2 - based on data from all the perfused vessels within each tumor. Tumors are arranged along the x-axis in the order of increasing tumor volume. Blue dots represent Day 21 tumors and orange dots represent Day 35 tumors. (c) Pairwise Pearson correlation matrix between morphological CVs and hemodynamic CVs. The upper triangular matrix illustrates the correlation coefficients, while the lower triangular matrix exhibits the underlying data from (a,b) and the linear fit to these values. Statistically significant entries (p < 0.05) are highlighted by orange boxes.

