Fig. 3.
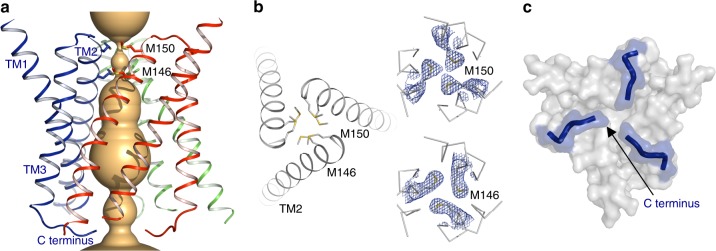
Ion conduction pore. a The central ion conduction pore of sCtr1, shown as orange surface. b The Cu+ selectivity filter. Two methionine rings (M146 and M150 in TM2) close to the extracellular side form the selectivity filter (left panel). The refined 2Fo−Fc electron density for the methionine side chains (contoured at 1.7 σ) is shown as blue meshes (right panels). c A hypothetical intracellular gate. Shown is the surface representation of sCtr1 from the intracellular side. The C-terminal tail following TM3 extends to the central pore axis, potentially forming an intracellular gate

