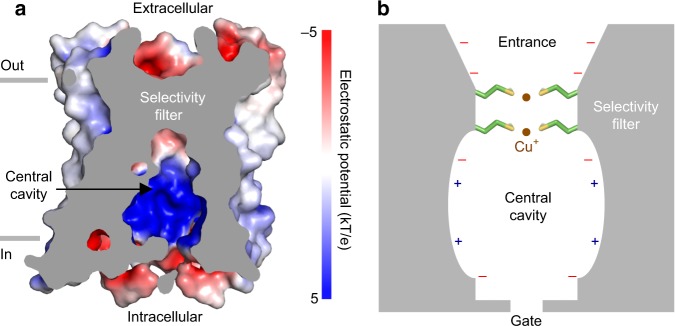
Fig. 5.
Cu+ permeation. a Cross-section view showing surface of the sCtr1 ion conduction pore colored by electrostatic potential (red, −5 kT/e; white, neutral; blue, +5 kT/e), with the relationship of the pore relative to the cell membrane shown. b Proposed mechanism of Ctr1 Cu+ ion selectivity and permeation. Only two subunits are shown for clarity. Two methionine rings coordinate two Cu+ ions. Electrostatic potential along the ion pore is indicated

