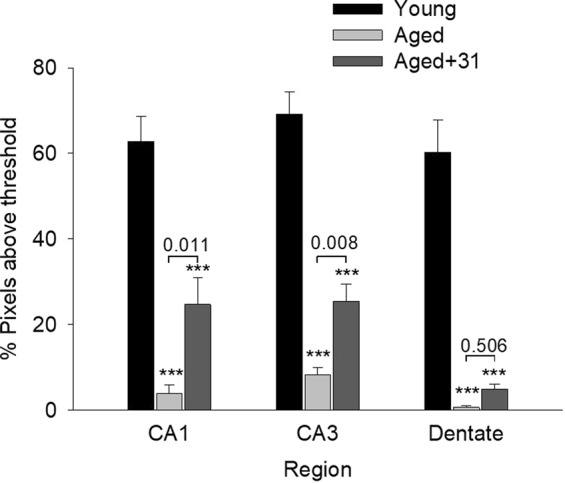
Figure 8.

MAP-2 expression in young, aged and LM11A-31 treated/aged mice. The MAP-2 was imaged to eliminate background signal and provide a clean MAP-2 signal. The values shown therefore reflect relative MAP-2 intensities but not absolute expression. A significant loss of MAP-2 signal is observed in aged mice, which is partially recovered with LM11A-31 treatment, significantly in the CA1 and CA3 regions. ***P < 0.001 for comparison with young animals, other P values as indicated; N = 6 animals/group; ANOVA with post-hoc Student-Newman-Keuls testing.
