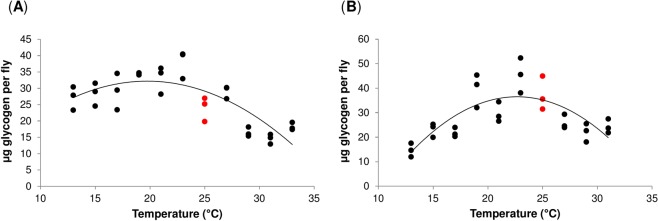
Figure 2.
Temperature induces changes in Drosophila glycogen stores. (A,B) Glycogen content (µg glycogen per fly) in Oregon R (A), and Canton S flies (B). Individual data points represent biological replicates. Data were compared to the values at 25 °C (red) by Welch’s t-test with the Benjamini-Hochberg correction for multiple testing. No significant differences were detected. For global statistical analyses see Supplementary Table S2.

