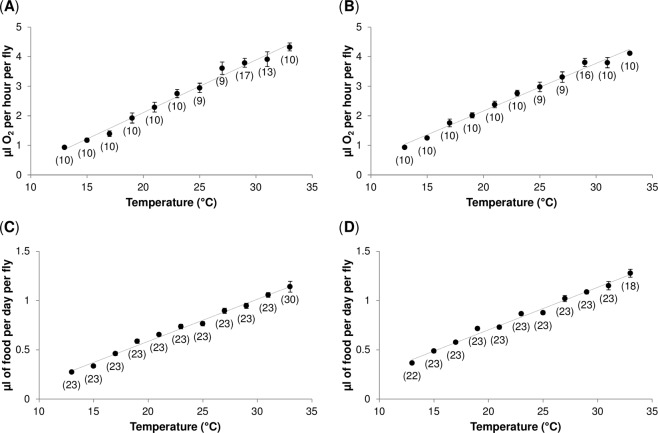
Figure 3.
Temperature–dependence of metabolic (A,B) and consumption rates (C,D). (A,B) The relationship between temperature and metabolic rate in Oregon R (A), and Canton S flies (B). The metabolic rate was measured in males that developed and were kept at 25 °C (12:12 L:D; 60–70% humidity) for four days and were prior to metabolic rate measurements exposed to given temperature for two days to allow acclimation. The values represent mean O2 consumption per fly per hour measured during two-hour period (10:00–12:00 AM). (C,D) The relationship between temperature and consumption rate in Oregon R (C), and Canton S flies (D). The values represent mean daily food intake of individual males measured over a four day period. For global statistical analyses see Supplementary Table S3. Lines represent linear regressions. Each data point represents the mean value ± s.e.m. Sample size is reported in parenthesis.

