Figure 5.
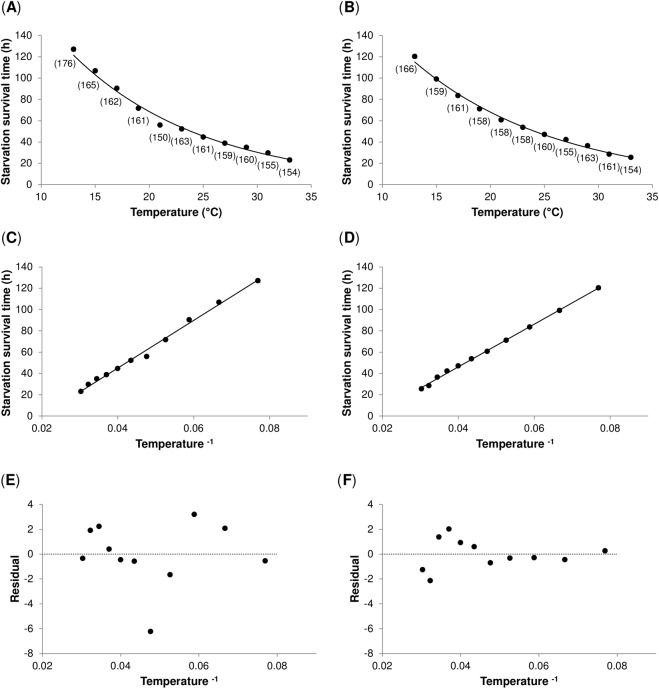
Temperature–dependence of starvation survival time. (A,B) The relationship between temperature and starvation survival time in Oregon R (A), and Canton S flies (B) is best described by an exponential function. Starvation survival time was measured in four-day old males that were transferred to 1% agarose (in distilled water) and exposed to eleven different temperatures. Lines represent exponential regressions. Each data point represents the mean value ± s.e.m. Sample size is reported in parenthesis. (C,D) The relationship between inverse temperature and the starvation survival time in Oregon R (C), and Canton S flies (D) is best described by a linear function. Lines represent linear regressions. (E,F) Plot of residuals vs inverse temperature in Oregon R (E), and Canton S flies (F). The residuals did not depart from 0 in a systemic manner (Shapiro-Wilk W test of normality: Oregon R: P-value = 0.08; Canton S: P-value = 0.99).

