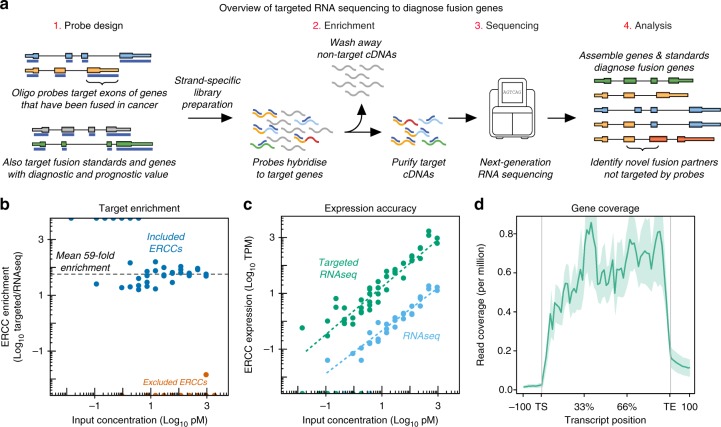
Fig. 1.
Overview of targeted RNAseq and panel validation. a Schematic of targeted RNAseq process. b Scatterplot of targeted RNAseq enrichment for ERCCs included on (blue) or excluded from (orange) the blood panel. c Abundance of captured ERCCs before and after targeted sequencing on blood panel. d Metagene plot of K562 targeted RNAseq read coverage across all genes on the blood panel. TS=Transcript Start site; TE=Transcript End site

