Fig. 3.
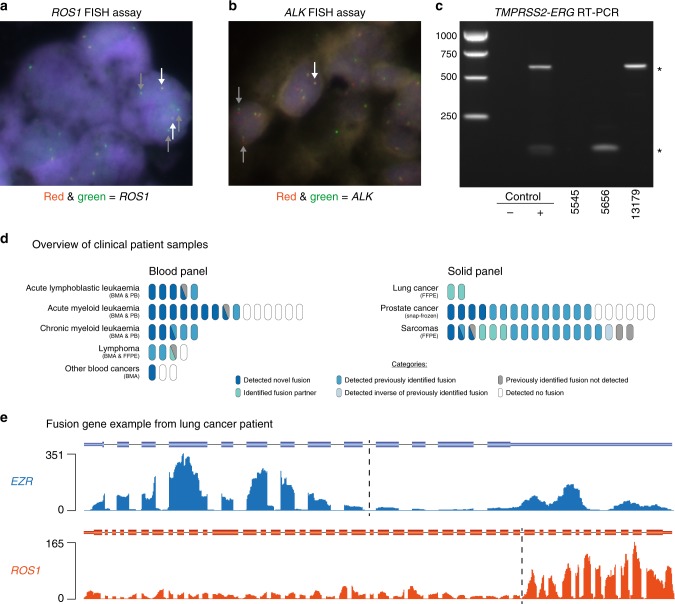
Fusion identification in clinical cohort samples. a FISH identification of ROS1 rearrangement in lung cancer sample MO-16-000393. Positive signal is 1 fused set of red and green dots and ≥1 isolated green dots per cell. White arrows point to fused dots; grey arrows point to green dots. b FISH identification of ALK rearrangement in lung cancer sample SP-15-11000. Positive signal is 1 fused set of red and green dots, 1 isolated red and 1 isolated green dot per cell. White arrows point to fused dots; grey arrows point to isolated red and green dots. c RT-PCR analysis to diagnose TMPRSS2-ERG fusion genes in prostate samples. * indicates TMPRSS2-ERG bands. Source data are provided as a Source Data file. d Overview of fusion gene identification in all clinical cohort samples; each oval represents one patient. Other blood cancers includes chronic lymphocytic leukaemia, multiple myeloma and uncategorised blood cancer patients. BMA=bone marrow aspirate; PB=peripheral blood; FFPE=formalin-fixed paraffin-embedded. e Read coverage across EZR and ROS1 genes in lung cancer patient sample MO-16-000393. Dotted line marks fusion junction of EZR-ROS1 fusion gene

