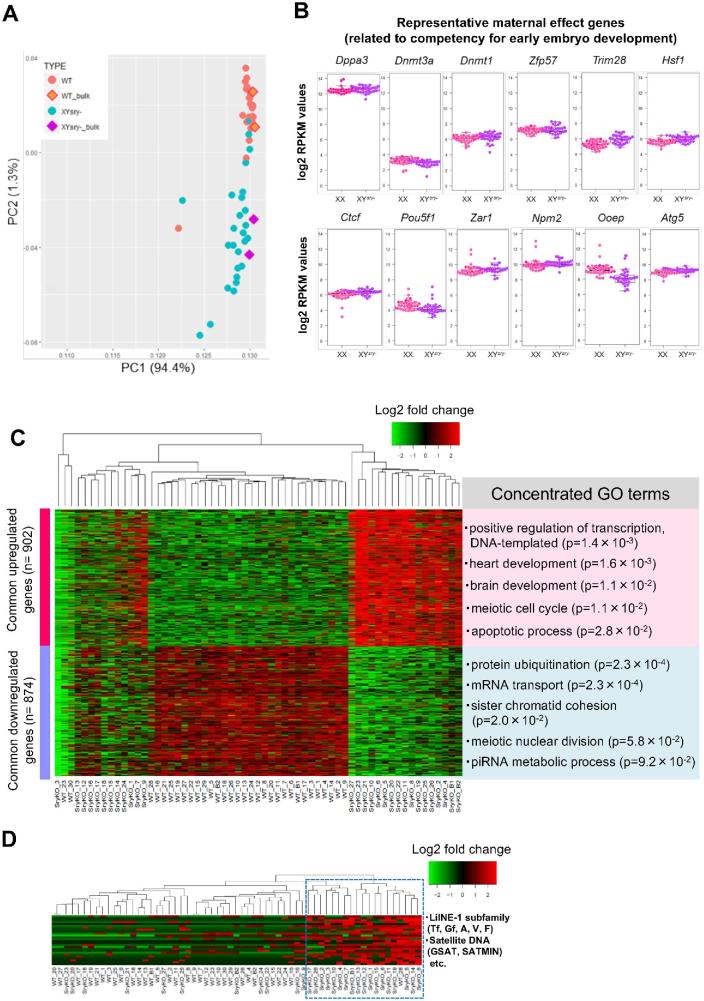
Figure 5.
Gene expression profiling of MII oocytes from XYsry− females via single-cell transcriptome analysis. (A) Bidimensional principal component analysis of gene expression profiles of XX (n = 30) and XYsry− (n = 27) single oocytes. The bulk oocyte (from 20 oocytes, n = 2) data are shown in the square. The first principal component (PC1) captures 94.4% of the gene expression variability, and the second principal component (PC2) captures 1.3% of the gene expression variability. (B) Boxplots of log2 RPKM values for 12 representative maternal effect genes in XX (pink) and XYsry− oocytes (purple). With respect to the expression of each gene, no significant difference was observed between the two groups. (C) Heatmap of the relative expression of the 902 common upregulated and 874 common downregulated genes expressed in each XYsry− MII oocyte as identified by k-means clustering. Representative GO terms and the enrichment P values are shown at right (Fisher exact test). WT, XX female; SryKO, XYsry− female. (D) Heatmap shows relative expression of 20 LINE-1 subfamilies, 3 ERV2 elements, and 3 forms of satellite DNA in XYsry− MII oocytes as identified using k-means clustering. The blue dashed rectangle indicates a cluster comprised of highly expressed retorotransposable elements. Notably, XYsry− MII oocytes were highly assigned to this cluster (18/19 (94.7%), Fisher exact test; P < 0.01). WT, XX female; SryKO, XYsry− female.

