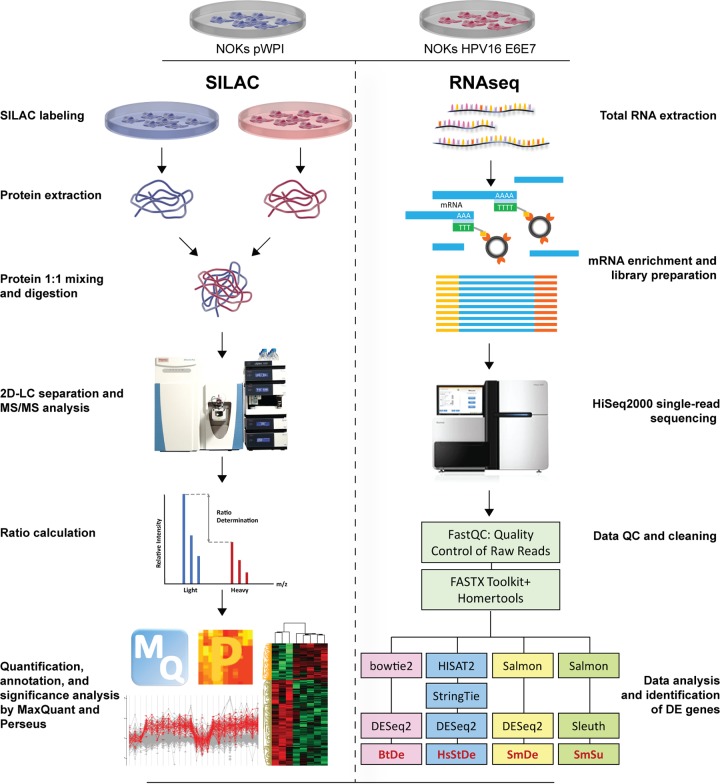
FIG 2.
Schematic overview of the experimental procedures used in this study. Protein and RNA were extracted from NOKs pWPI and NOKs HPV16 E6E7 to perform SILAC and RNA-Seq experiments in parallel. Proteins from the two cell lines were quantified and mixed at a ratio of 1:1, followed by trypsin digestion, two-dimensional LC separation of peptides, and MS/MS analysis. Protein identification, abundance calculation, and annotation were performed with MaxQuant. Perseus was used for comparison and statistical analysis. mRNA was enriched for library preparation and single-read sequencing. Raw reads were put through the FASTX Toolkit and Homertools to remove adaptor sequences and reads with bad quality. Four different sets of tools, including Bowtie2 plus DESeq2, HISAT2 plus StringTie plus DESeq2, Salmon plus DESeq2, and Salmon plus Sleuth were used for read alignment and gene expression quantification. The outputs of each set of tools were abbreviated BtDe, HsStDe, SmDe, and SmSu, respectively. Data from SILAC and RNA-Seq were combined for pathway analysis and interpretation of biological functions. Illustrations for the dish, cell, and protein were obtained from Library of Science and Medical Illustrations (http://www.somersault1824.com) and are used here with permission.

