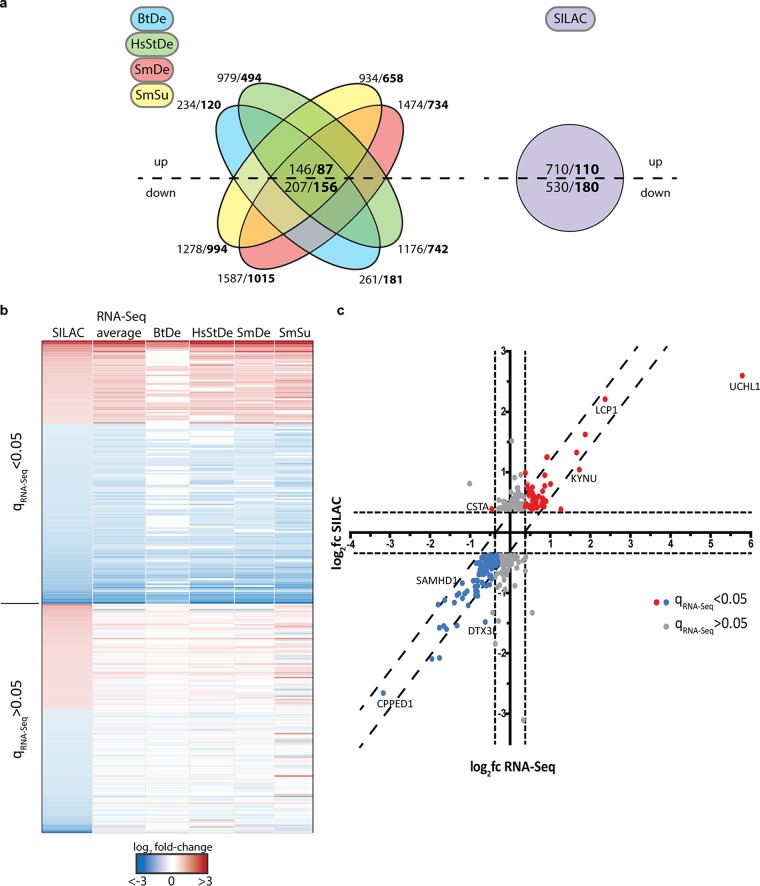
FIG 3.
Graphic representation of differentially regulated proteins obtained by SILAC and RNA-Seq analyses. (a) Diagrams show the numbers of DE genes in RNA-Seq (left) and SILAC (right) results. Up- and downregulated factors were used separately for plotting. Numbers represent the factors with q values of <0.05 (RNA-Seq) or P values of <0.05 (SILAC). In bold, the numbers of factors with fold changes of at least ±1.5 (RNA-Seq) or ±1.3 (SILAC) are shown. For RNA-Seq results, numbers of DE genes shared by all four methods are shown in the center. (b) Heatmap of the 290 significantly altered proteins with at least a ±1.3 fold change from the corresponding genes in the RNA-Seq analysis using four bioinformatic workflows. One hundred fifty-five genes (upper part of heat map) displayed significant changes (q values of <0.05) in at least two of the four RNA-Seq data sets, whereas the other genes showed significant alterations in only one or none of the lists. (c) Graphic representation of the correlation of log2 fold changes observed for factors from panel b between SILAC and RNA-Seq results. Values for RNA-Seq represent the averaged log2 fold changes from all four lists. Blue and red dots show factors with q values of <0.05 in the RNA-Seq analysis that were significantly changed from values from the SILAC analysis. Gray dots show genes with q values of >0.05. Dashed lines represent cutoffs of ±1.5 fold change (RNA-Seq, x axis) or ±1.3 fold change (SILAC, y axis).

