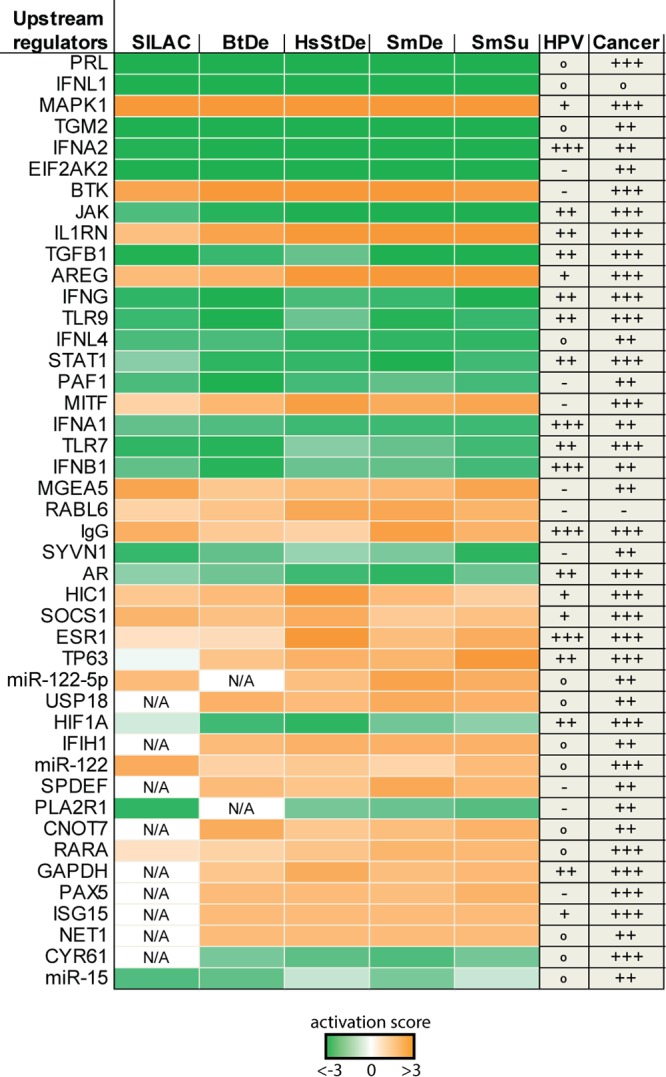
FIG 4.

Activity profile of upstream regulators predicted by pathway analysis. Significantly deregulated factors obtained by different bioinformatic processing methods and SILAC data were individually analyzed using the core analysis function of Ingenuity Pathway Analysis (IPA) and subsequently compared with each other. Depicted are predicted upstream regulators displaying activation factors higher than 3 (orange) or lower than −3 (green). Pubmed citations with HPV or cancer in previous studies are indicated as +++ (mentioned >100 times), ++ (mentioned >10 times), + (mentioned at least 5 times), ° (mentioned <5 times), and – (not reported).
