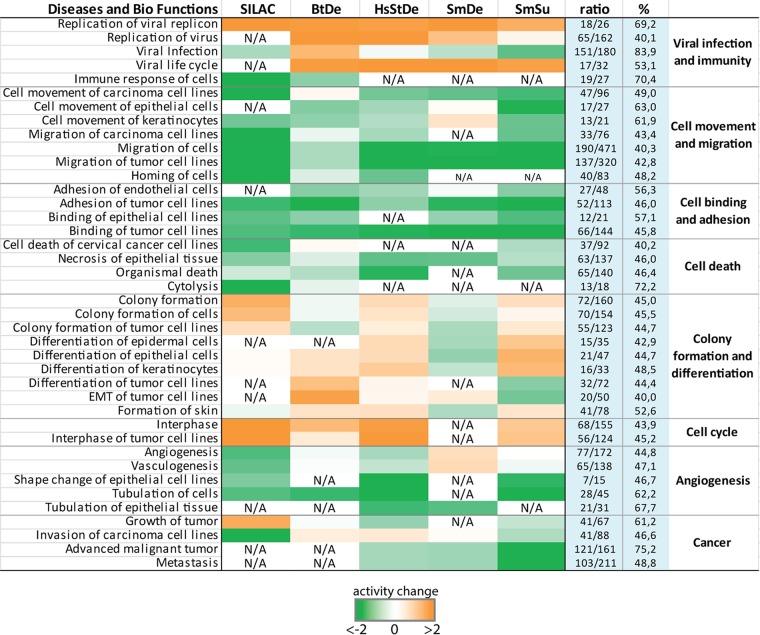
FIG 6.
Predicted diseases and biological functions based on genes affected by upstream regulators in response to HPV oncogene expression. Genes that are regulated by predicted upstream regulators in the individual data sets were subjected to comparative pathway analysis using IPA. Predicted effects on the highlighted diseases and biological functions in each group are represented by color. Orange, increased activity; green, decreased activity; N/A, not represented in the respective data set. The ratios (also shown as percentages) depict how many of the DE genes/proteins that were assigned to the respective pathway by IPA were regulated by one or more of the upstream regulators in Fig. 4.

