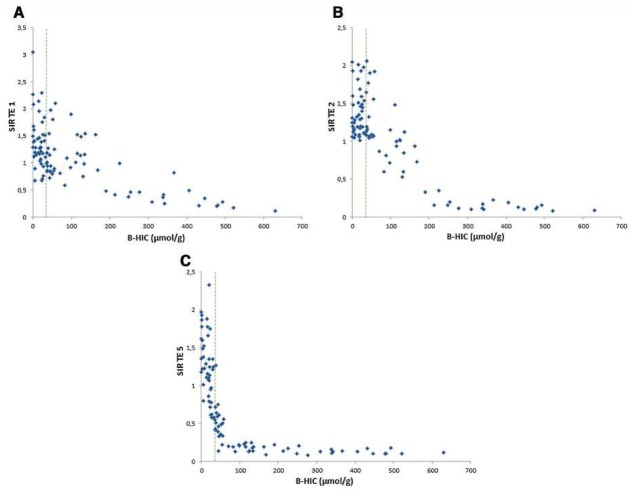
Fig. 2.
(a) Graphical representation of liver-to-muscle SIR as compared to B-HIC for the first echo. This TE enabled quantification in patients with severe overload, above 200 μmol/g, but led to dispersion and lack of correlation for mild overload cases. With this opposed-phase TE, a signal decrease can also be due to liver steatosis. (b) Graphical representation of liver-to-muscle SIR as compared to B-HIC for the second echo. This graph shows a progressive decrease in SIR between normal iron concentration and 200μmol/g. (c) Graphical representation of liver-to-muscle SIR as compared to B-HIC for the fourth echo. This graph shows a fast decrease in SIR as the iron concentration increases, achieving a more accurate evaluation of mild iron concentration, including in the normal range. The algorithm can be tuned to the appropriate echo according to the overload observed.

