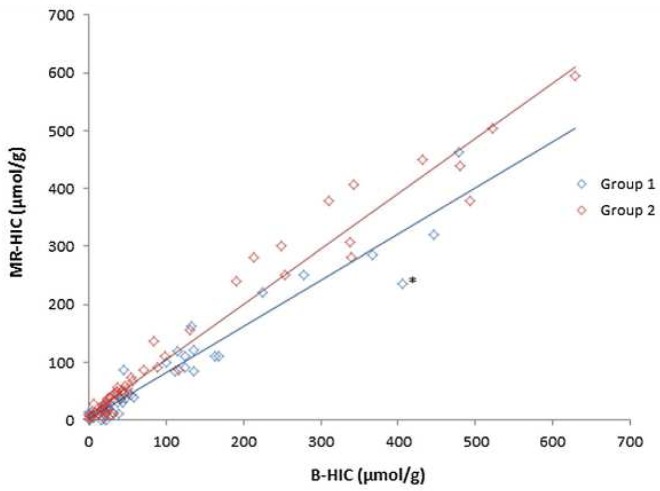
Fig. 3.
MR-HIC versus B-HIC correlation graph. Correlation between MR-HIC and B-HIC was very good (R2>0.95). When B-HIC is over 200 μmol/g, the correlation and R2 value are stable but a slight discordance can be noted for some values. The asterisk is a discordant point relates to a patient in Group 1 and detailed in fig 6.

