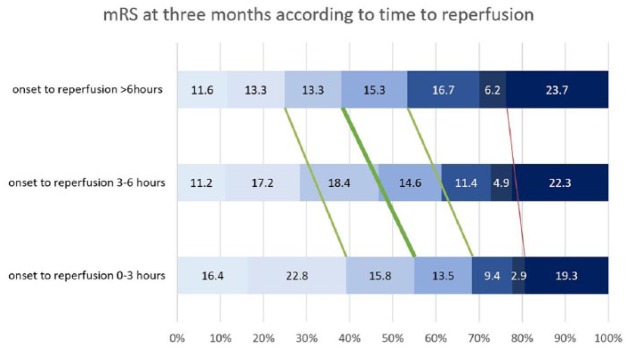
Figure 1.
Day 90 functional outcome at 3 months according to time to reperfusion.
Distribution of mRS scores at 3 months, according to time to reperfusion strata. Analysis was done using multivariable binary logistic regression analysis adjusting for prespecified confounders outlined in the methods section for TTR per hour increase. The thick green line proposed by Goyal and colleagues indicates a highly significant beneficial treatment effect with higher rate of the primary outcome mRS 0–2 (aOR 0.933, 95% CI 0.887–0.981, p = 0.007). The thin green line indicates a significant beneficial treatment effect with higher rate of mRS 0–1 (aOR 0.929, 95% CI 0.877–0.985, p = 0.013) and mRS 0–3 (aOR 0.955, 95% CI 0.911–1.000, p = 0.049). The thin red line indicates a beneficial, but non-significant, treatment effect for mortality (aOR 0.988, 95% CI 0.933–1.046, p = 0.680).
mRS, modified Rankin scale.

