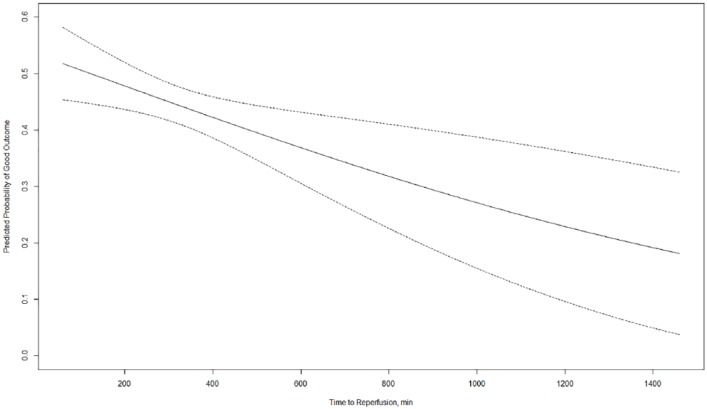
Figure 2.
Probability of good functional outcome (mRS 0–2) with margins plot, including 95% confidence intervals.
For this analysis, time to reperfusion was used as a continuous variable and multivariable binary logistic regression analysis was performed, adjusting for prespecified confounders outlined in the methods section. Per hour delay of reperfusion there was a 1.5% decreased probability of good functional outcome.
mRS, modified Rankin scale.

