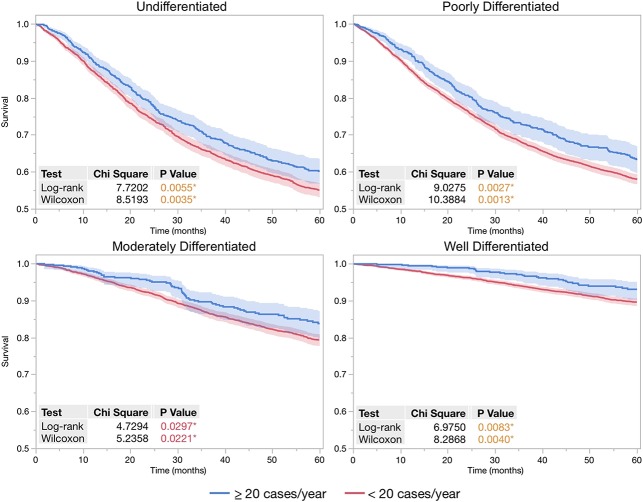
Fig. 1.
When stratifying by tumor grades, 5-year Kaplan-Meier curves demonstrate patient survival was improved when treated at facilities with average patient volume ≥ 20 annually compared with lower volume facilities. Log-rank and Wilcoxon tests for survival difference were calculated for each set of Kaplan-Meier curves. Probability values < 0.05 were considered significant, indicated by an asterisk.

