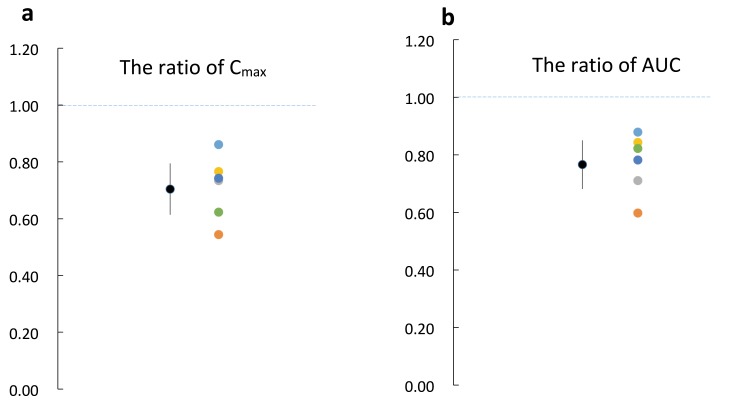
Fig. 3.
The ratios of RST Cmax and AUC in combination with TJ to RST single administration. Color circles indicate ratios of AUC and Cmax in each subject, and black circles indicate the mean ratio and 95% confidence interval. (ratio is calculated by RST + TJ / RST alone). The geometric mean ratios of AUC and Cmax were 0.77 ± 0.08 and 0.7 ± 0.09, respectively. AUC, the area under the plasma RST concentration-time curve; Cmax, maximum plasma drug concentration; RST, rosuvastatin; TJ, tanjin.

