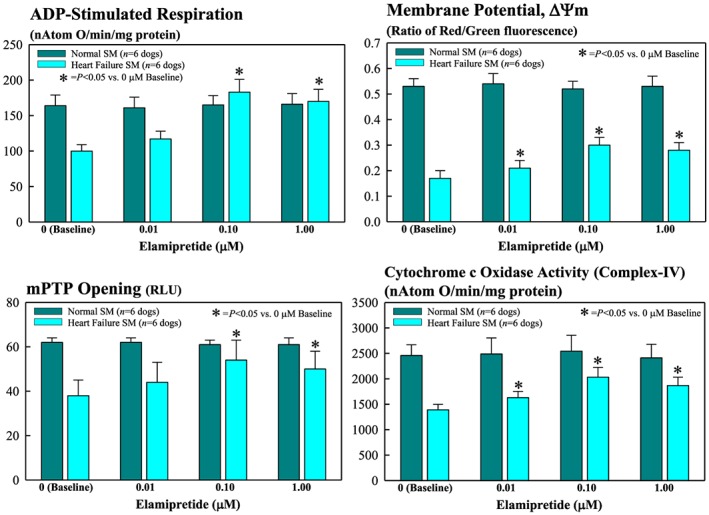
Figure 2.

Bar graphs (mean ± standard error of the mean) depicting changes in mitochondrial functional measures of skeletal muscle (SM) myofibrillar mitochondria of normal and heart failure dogs. Depicted measures are ADP‐stimulated respiration (top left), membrane potential (top right), permeability transition pore (mPTP) opening (bottom left), and cytochrome c oxidase (complex IV) activity (bottom right) after exposure to 0.01, 0.10, and 1.0 μM elamipretide. RLU = relative light units.
