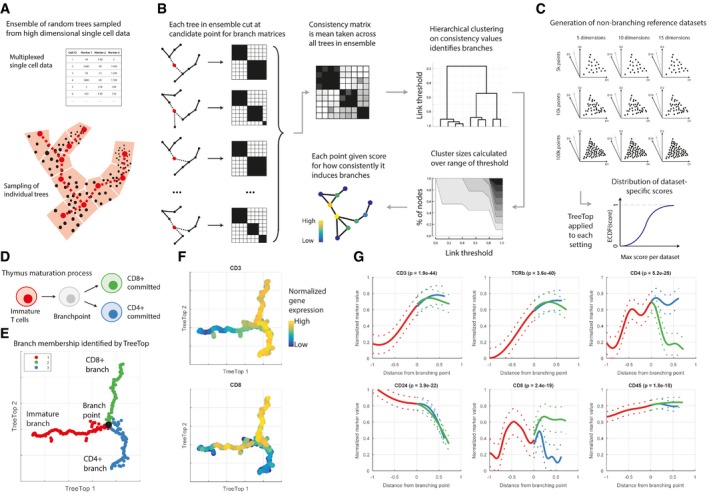
Figure 1. TreeTop methodology and demonstration.

- Reference nodes are selected to be evenly distributed through data via seeding algorithm for k‐means (Moseley et al, 2012); all other cells are assigned to closest reference node. Each tree is sampled by selecting a cell from each partition uniformly at random, then joining these points via a minimum spanning tree.
- To assess each reference node as a branch point (red), each tree in the ensemble is cut (removed edges are shown dashed), partitioning the remaining cells. Mean pairwise co‐occurrence across all branch matrices stored in consistency matrix, i.e. (i, j) entry is proportion of trees in which cells i and j were in the same branch, when cut at the red cell. Hierarchical clustering (single linkage) is performed on each consistency matrix. Sizes of the largest clusters are then calculated over all possible dendrogram cut heights, and used to score each point for branching; raw branching score is mean size of third and smaller clusters over all thresholds.
- Cartoon of reference datasets based on randomly generated synthetic datasets defined to contain structure but no branch points, over a range of parameters for comparison with different sizes of input datasets.
- Cartoon of cell types in maturation of T cells in thymus.
- Force‐directed graph layout of mass cytometry thymus data [30 antibodies used (Setty et al, 2016)], pre‐processed with diffusion maps (Materials and Methods; Coifman et al, 2005). Point with highest relative branching score (black) is reported branch point, although more than one point may have a score indicating branching. Colours indicate identified branches.
- TreeTop layout annotated with abundances of selected proteins.
- Abundance profiles for proteins on branches; x‐axis is mean tree distance from identified branch point. Proteins selected for most significant differences between branches. Significance is calculated via ANOVA applied to marker abundances for each branch, Bonferroni‐corrected.
