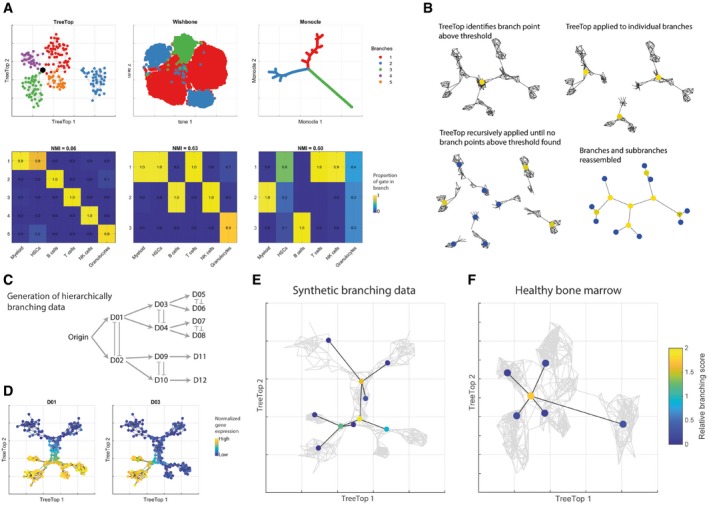
Figure 2. TreeTop applied to mass cytometry data is consistent with shallow hierarchy model of hematopoiesis.

- TreeTop, Wishbone and Monocle compared on healthy human bone marrow mass cytometry data (Amir et al, 2013). TreeTop and Wishbone applied to full dataset, Monocle applied to sample of 2,000 cells. Top row shows layouts and branches identified by each method. Bottom row shows specificity of manual gate allocation to identified branches: heading of plot shows normalized mutual information (NMI; Danon et al, 2005) across all gates, branches. Ungated populations excluded. Plots showing layouts annotated by markers used are shown in Appendix Fig S8.
- Cartoon of recursive application of TreeTop to identify hierarchies of branch points. TreeTop decides whether to recurse at each step by reference to relative branching score.
- Cartoon of generation of hierarchically branching synthetic data, following classical hematopoietic architecture (Weissman et al, 2001; Materials and Methods).
- TreeTop layout of synthetic deep hierarchy branching data as positive control, annotated species selected to illustrate branch evolution.
- Result of recursive application of TreeTop to synthetic branching data, showing identification of hierarchy of branch points.
- Result of recursive application of TreeTop to healthy human bone marrow data, showing only one branch point identified.
