Figure 3.

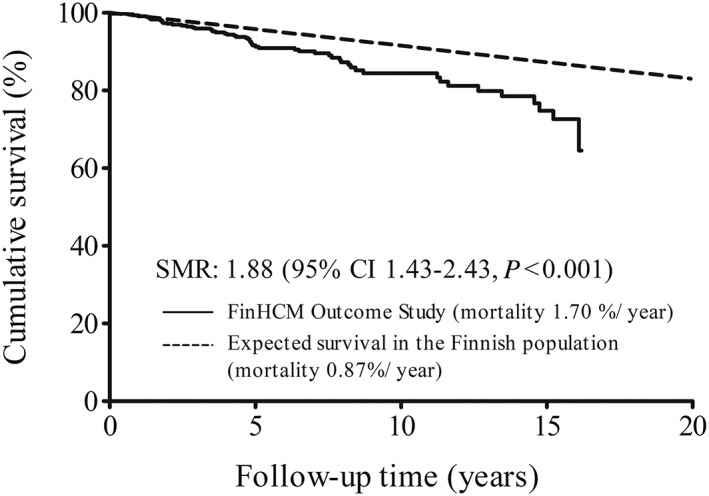
Kaplan–Meier survival in the FinHCM Outcome Study (n = 482) compared with expected all‐cause mortality in the general Finnish population matched for age and sex. CI, confidence interval; SMR, standardized mortality ratio.

Kaplan–Meier survival in the FinHCM Outcome Study (n = 482) compared with expected all‐cause mortality in the general Finnish population matched for age and sex. CI, confidence interval; SMR, standardized mortality ratio.