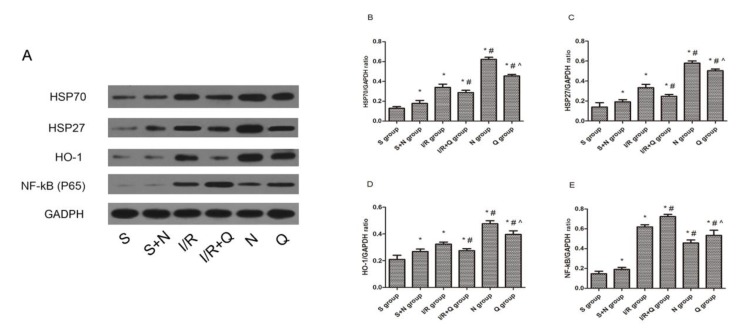
Figure 2.
Representative Western blots showed the effects of H2S on HSP70, HSP27, HO-1, and NF-kB (p65) expression in rat kidneys after 45 min of ischemia followed by 24 hr of reperfusion. GADPH was used to show equal amounts of protein loading in each lane. (A) Representative Western blots showed the effects of H2S on HSP70, HSP27, HO-1, and NF-kB (p65) expression. Relative band densities of (B) HSP70, (C) HSP27, (D) HO-1, and (E) NF-kB (p65) to the mean value of the control. Bars represent means ± standard error of the mean (n=8 per group); *P<0.05 vs the sham group, #P<0.05 vs the I/R group, ^P<0.05 vs the NaHS group. S, sham group; S+N, sham + NaHS group; I/R, ischemia-reperfusion group; I/R+Q group, ischemia-reperfusion +quercetin group; N, NaHS (sodium hydrosulfide) group; Q, quercetin.+ NaHS group

