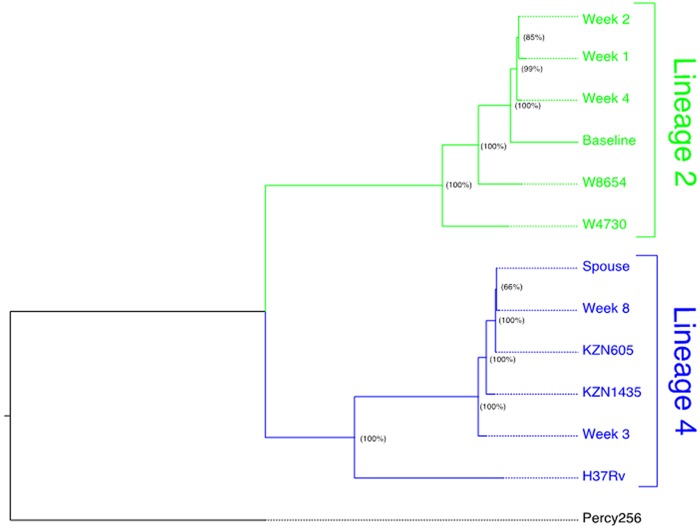
FIG 3.
Genotyping demonstrates distinct M. tuberculosis lineages in a patient (PID 151) who acquired extensively drug-resistant tuberculosis (XDR-TB) on treatment (A) and analysis of heterozygous single- nucleotide polymorphisms reveals low frequency mixed infection from early in treatment (B). (A) Maximum-likelihood phylogenetic reconstruction. Whole-genome sequencing (WGS) data were obtained for baseline and week 1, 2, 3, 4, and 8 M. tuberculosis cultures from the patient who developed XDR-TB on treatment, as identified by the reporter phage assay (patient 151). Contact investigation determined that the patient’s spouse was previously diagnosed with XDR-TB, and we subsequently obtained WGS data for an M. tuberculosis isolate from the patient’s spouse. Phylogenetic reconstruction determined that initial isolates from patient 151 (baseline, week 1, and week 4) cluster distinctly with representative archival isolates from M. tuberculosis phylogeographic lineage 2 (W8654 and W4730) and isolates collected later during treatment (week 3 and week 8), as well as the isolate obtained from the patient’s spouse, cluster distinctly with archival MDR-TB and XDR-TB isolates collected in KwaZulu-Natal, South Africa (KZN1435 and KZN605). Node labels indicate bootstrap support (proportion of 100 bootstrap replicates) supporting each clade. (B) Whole-genome sequencing to detect mixed infection in early time points. To evaluate for potential evidence of polyclonal infection, we characterized sequence read heterozygosity at SNPs. We defined mixed variant calls as SNPs where reads matching the reference accounted for >25% of the total read depth. The numbers and proportions of all unfiltered SNPs meeting these criteria for each isolate are included column 2. We used representative archival strains to define nonoverlapping subsets of SNPs that are unique to either M. tuberculosis phylogeographic lineage 2 or lineage 4. Isolates phylogenetically grouped in lineage 2 in panel A share 362 unique SNPs; those grouped in lineage 4 share 425 unique SNPs. As a proxy estimate for the extent of admixture between the pretreatment L2 isolate and the L4 spousal isolate, we tabulated the number of L4-specific SNPs called for each isolate (column 3) and quantitated the average read depth at lineage 4-specific SNPs (column 4) for each isolate obtained during treatment. The normalized averaged read depth, i.e., the average read depth at lineage 4-specific SNPs divided by the average read depth for all isolates in a sample, is provided in column 6.

