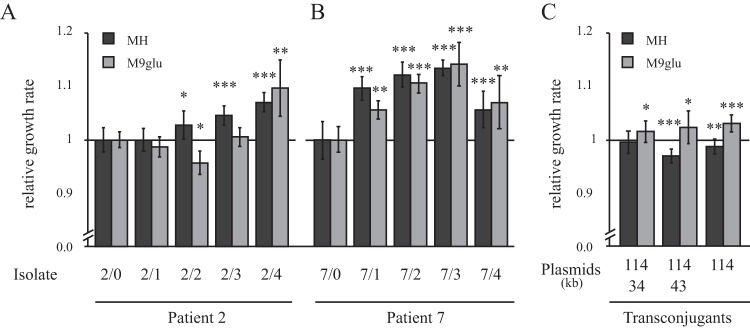
FIG 4.
Relative growth rates of isolates from patients 2 (A) and 7 (B) in Mueller-Hinton medium (MH; dark gray columns) and M9 supplemented with 0.2% glucose (M9glu; light gray columns). Growth rates were normalized to the UTI isolate (set to 1) for each patient set of isolates. The standard deviations from five biological replicates are indicated. (C) Relative growth rate of transconjugants (MG1655) with plasmids from the isolates of patient 7. MG1655 without plasmid is set to 1 (not shown in the picture). The standard deviations from 16 biological replicates are indicated. Asterisks denote significant differences with respect to the UTI isolate (Student t test: *, P < 0.05; **, P < 0.01; ***, P < 0.001).

