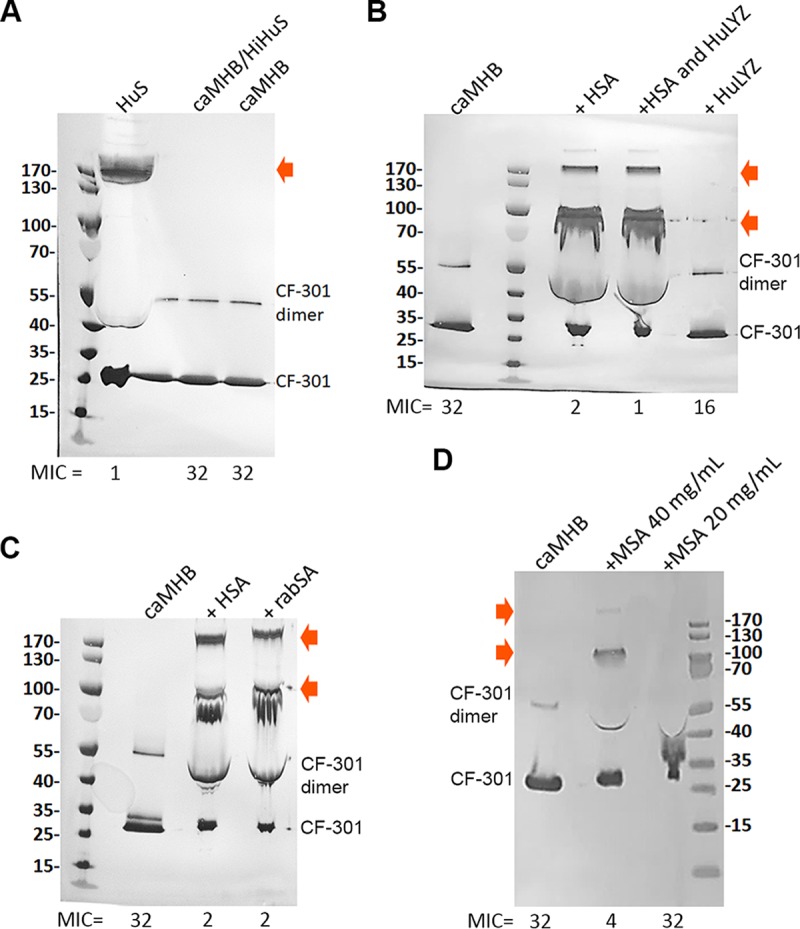
FIG 3.

Western blot analyses (using anti-CF-301 antibodies) of MIC well samples under different incubation conditions. High-molecular-mass multimers are indicated by arrows. MIC values are indicated (micrograms per milliliter). (A) Comparison of human serum to caMHB/HiHuS and caMHB. (B) Analysis of caMHB supplemented with HSA (40 mg/ml) and/or HuLYZ (10 μg/ml). (C) Comparison of caMHB supplemented with HSA (40 mg/ml) or rabbit SA (rabSA) (40 mg/ml). (D) Analysis of caMHB supplemented with MSA at 40 mg/ml and 20 mg/ml. Molecular mass standards are indicated (in kDa).
