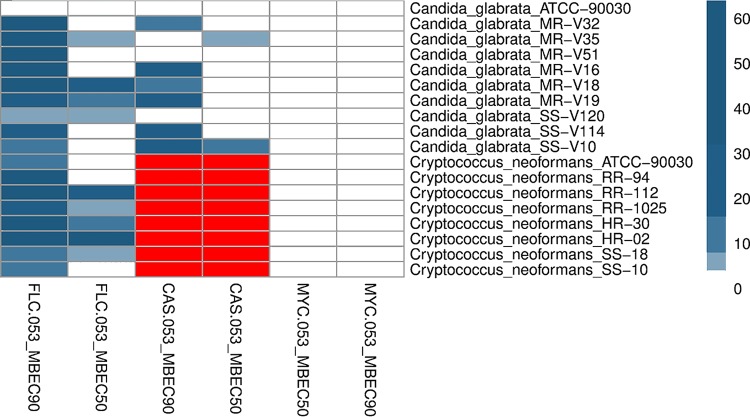
FIG 2.
Heatmap and cluster analysis of MYC-053, FLC, and CAS against 48-h-old C. glabrata and C. neoformans biofilms expressed as MBEC50 or MBEC90, in multiples of MIC. The MIC values were ordered by hierarchical clustering using the Euclidean distance method and are represented by a heatmap, with the intensity indicated by a color code (dark blue, MIC; light blue, 8× the MIC; white, ≥64 times the MIC). C. glabrata strains that were not tested in this assay and C. neoformans strains that were not tested against CAS are highlighted in red.

